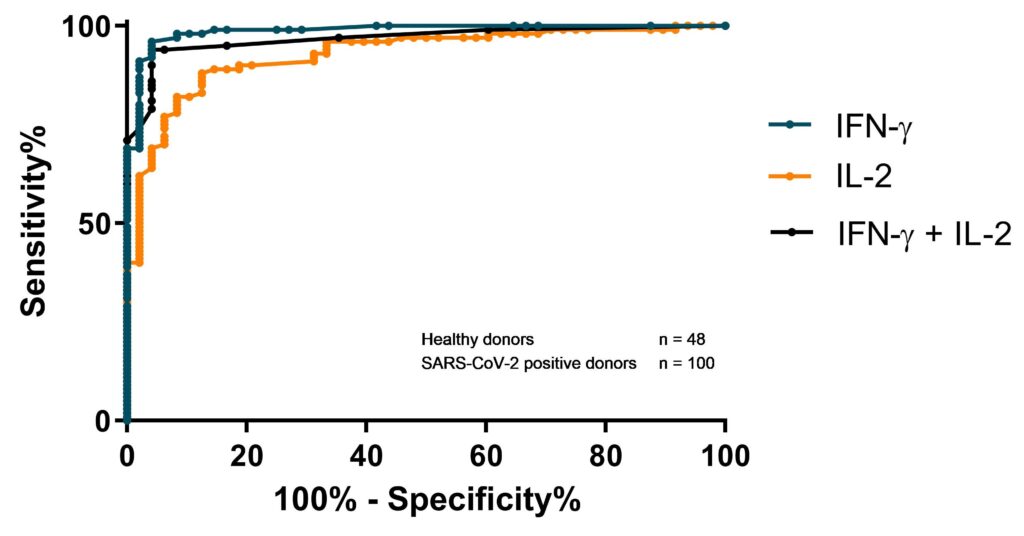
SARS-CoV-2 IFN-y / IL-2 FluoroSpot ROC curve
The receiver operating characteristic (ROC) curve shows the true positive rate (sensitivity) versus the false positive rate (100-specificity) of SARS-CoV-2 IFN-γ / IL-2 FluoroSpot for different cut-offs.
Results were compiled by interrogating clinical diagnostics (PCR and serology).