T cell reactivity to SARS-CoV-2 vaccines
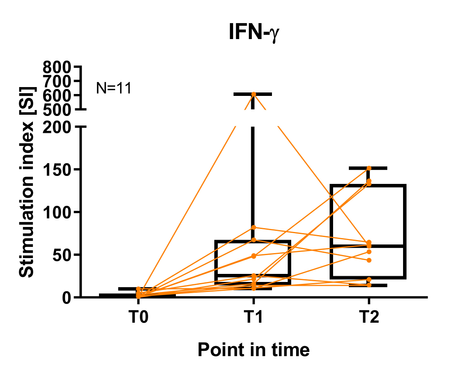
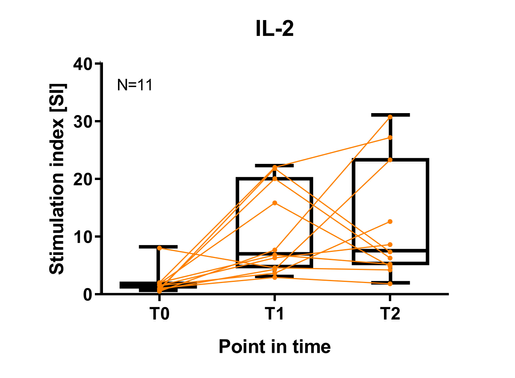
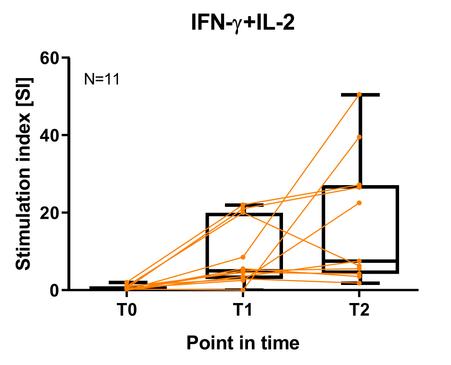
SARS-Cov-2 FluoroSpot results (SI; spot count antigen stimulated sample divided by spot count unstimulated sample) before vaccination (TO), two weeks after the first vaccination (T1) and two weeks after the second vaccination (T2) of 11 donors are visualized as box plots.
Data points obtained from each donor are connected by lines.